The macro investor
You think in regimes, not tickers.
- Tariff exposure ranked across 113+ countries
- Yield curve, VIX term structure & stress meter
- Crisis playbook with historical asset outcomes
- Live US debt clock and central-bank rates
Live now · Web & iOS
Live global markets, AI trade signals with exact entry, stop and target, the smart-money disclosures pros track, and the macro picture — all in one place.
For the macro-curious who follow tariffs, smart-money disclosures and the debt clock — and the self-directed traders who act on them.
Who it's for
You think in regimes, not tickers.
You need a level, not a vibe.
You answer for exposure, on the record.
Live, right now
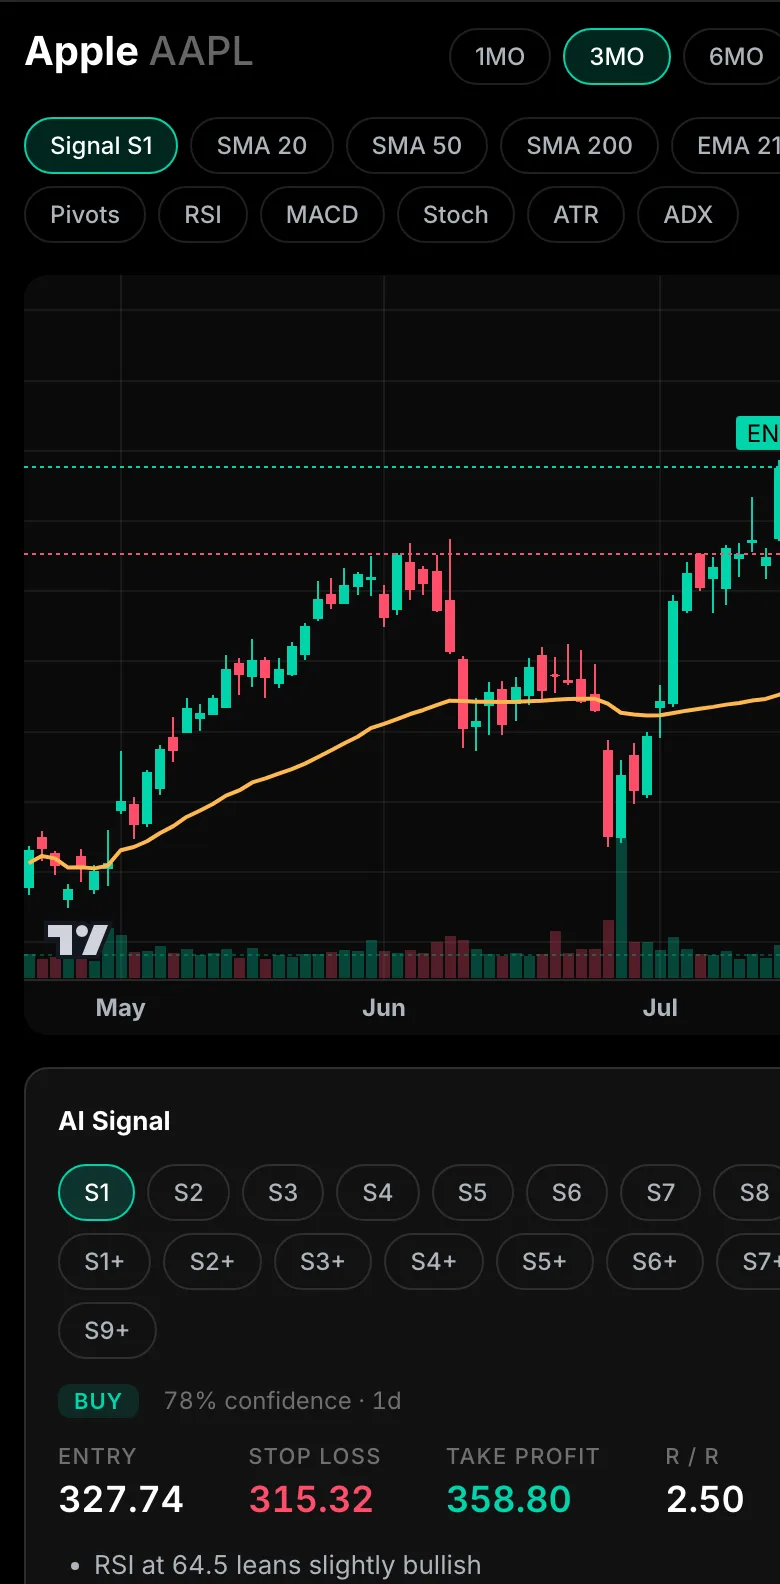
AI Trading Signals
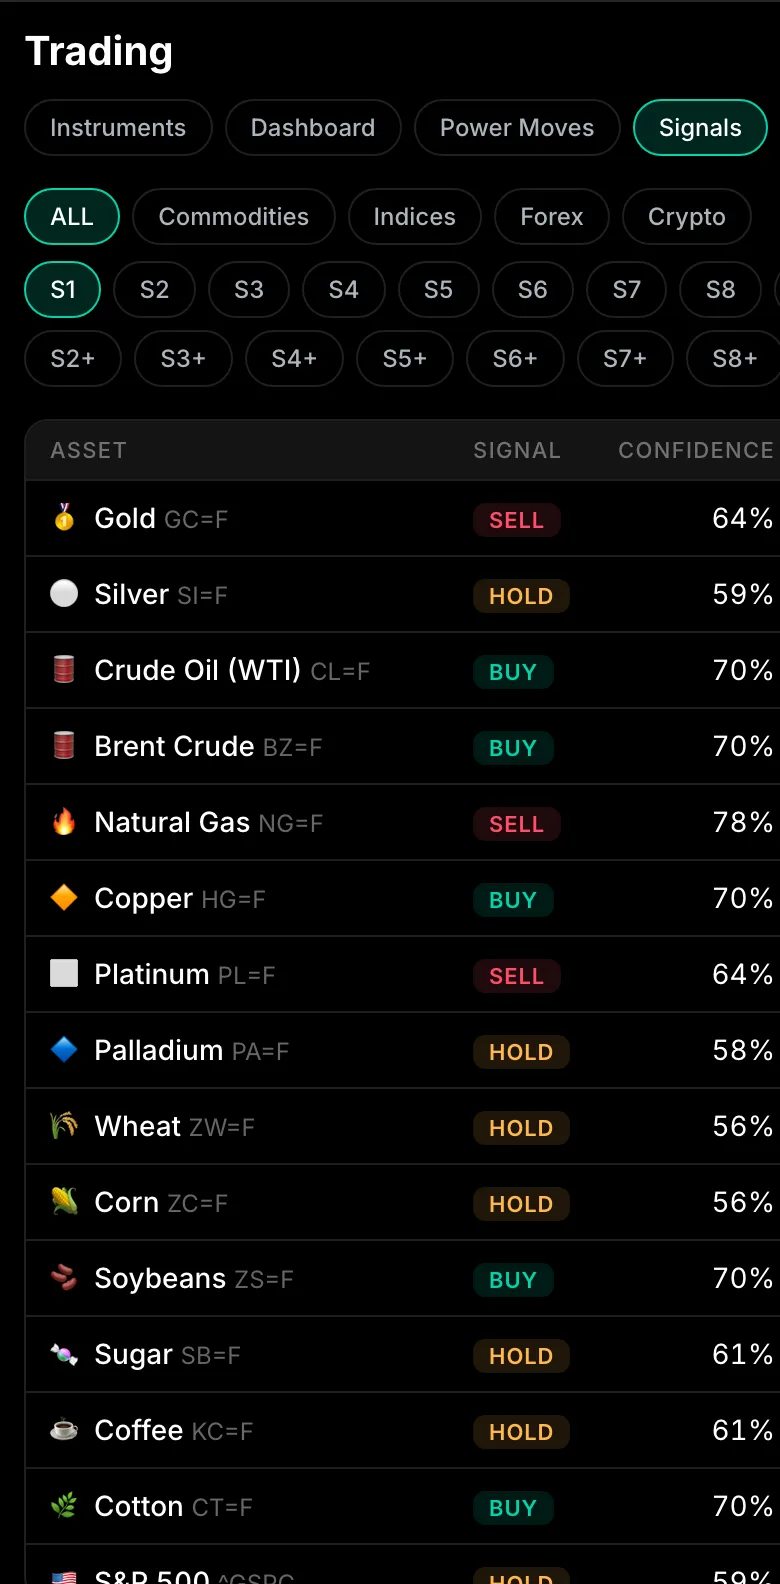
Nine strategy engines analyze 49+ assets across commodities, indices, forex and crypto — and commit to an answer: BUY HOLD SELL with a concrete entry, stop-loss, take-profit, risk/reward ratio, confidence score, and the reasoning behind the call.
RSI at 64.5 leans slightly bullish · price reclaimed the 50-day average.
Power Moves — 10X Scanner
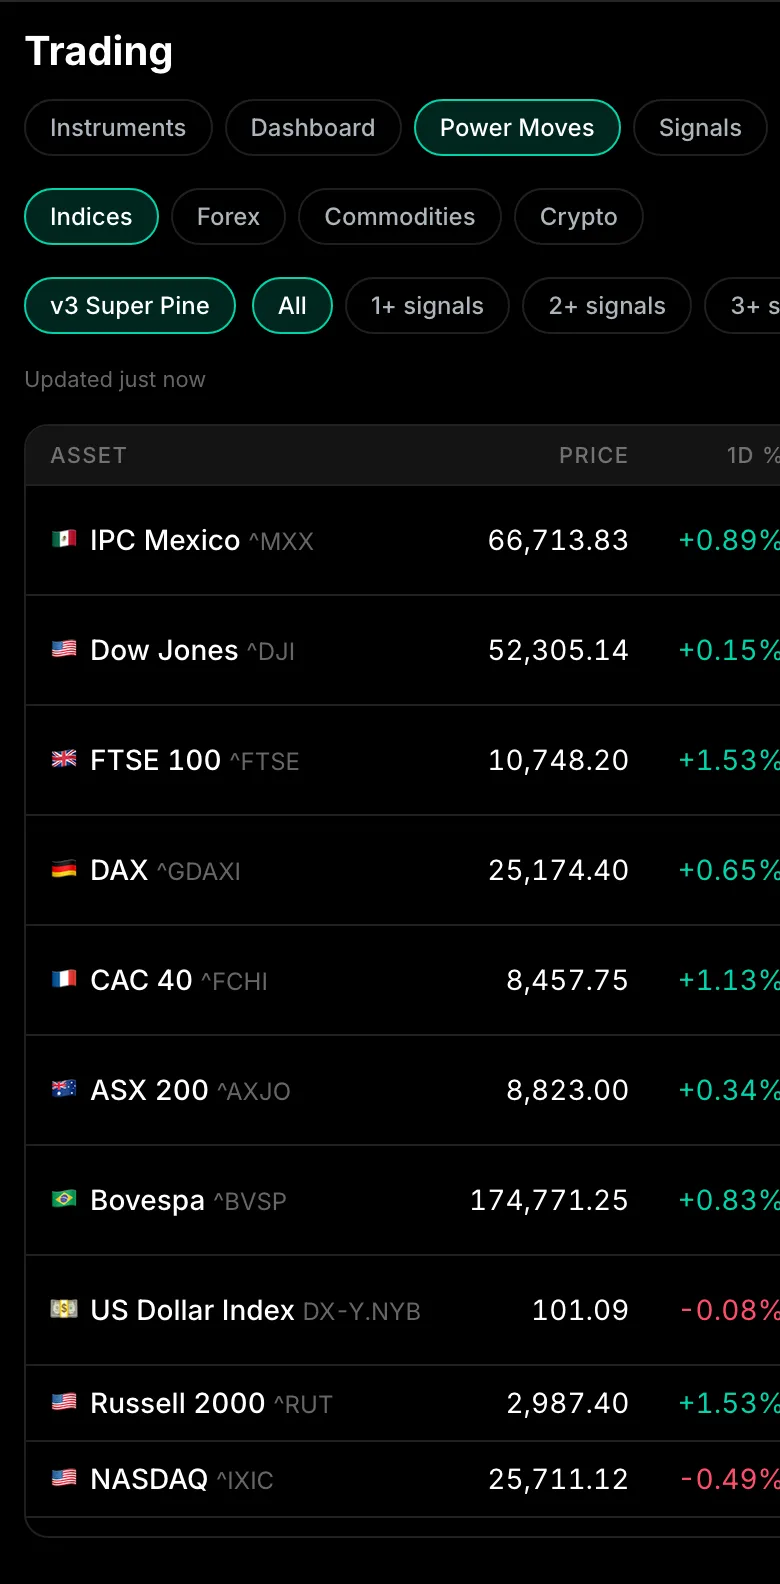
A regime-breakout scanner that screens whole asset classes — indices, forex, commodities, crypto — through three generations of Pine-aligned engines. The v3 "Super Pine" engine hunts five structural signals and ranks everything by how many are firing right now.
Live Global Markets
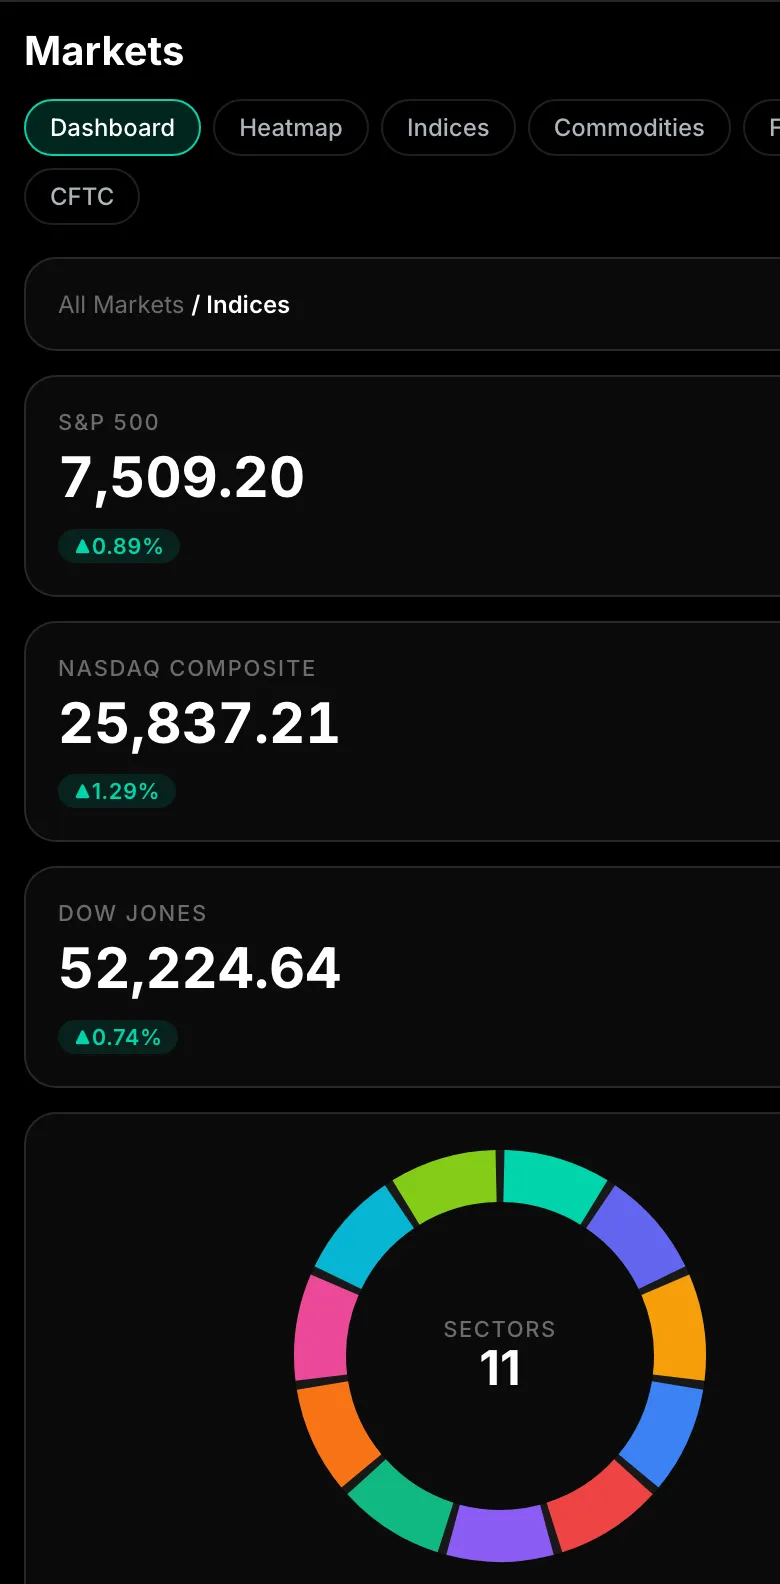
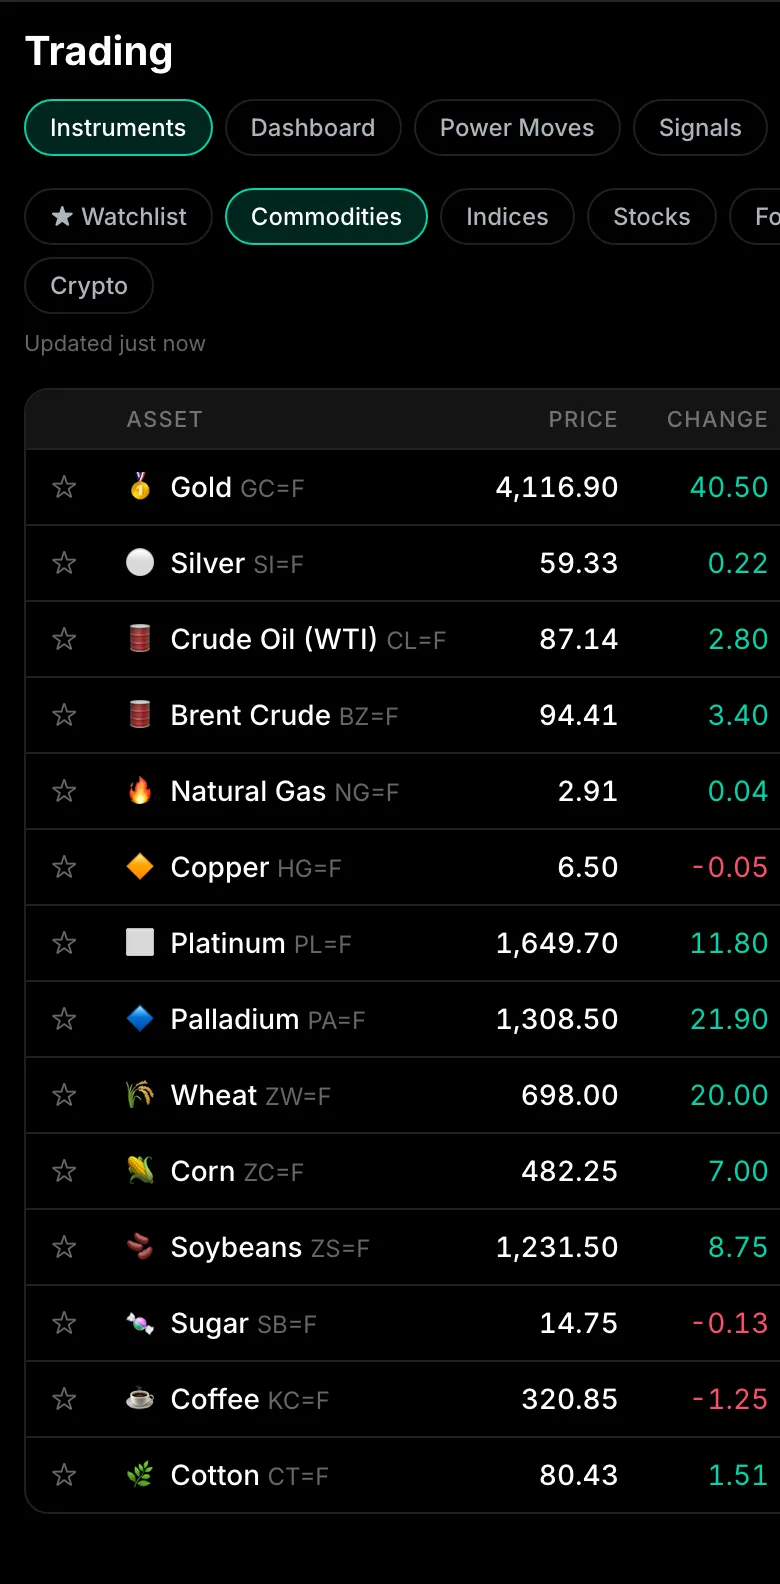
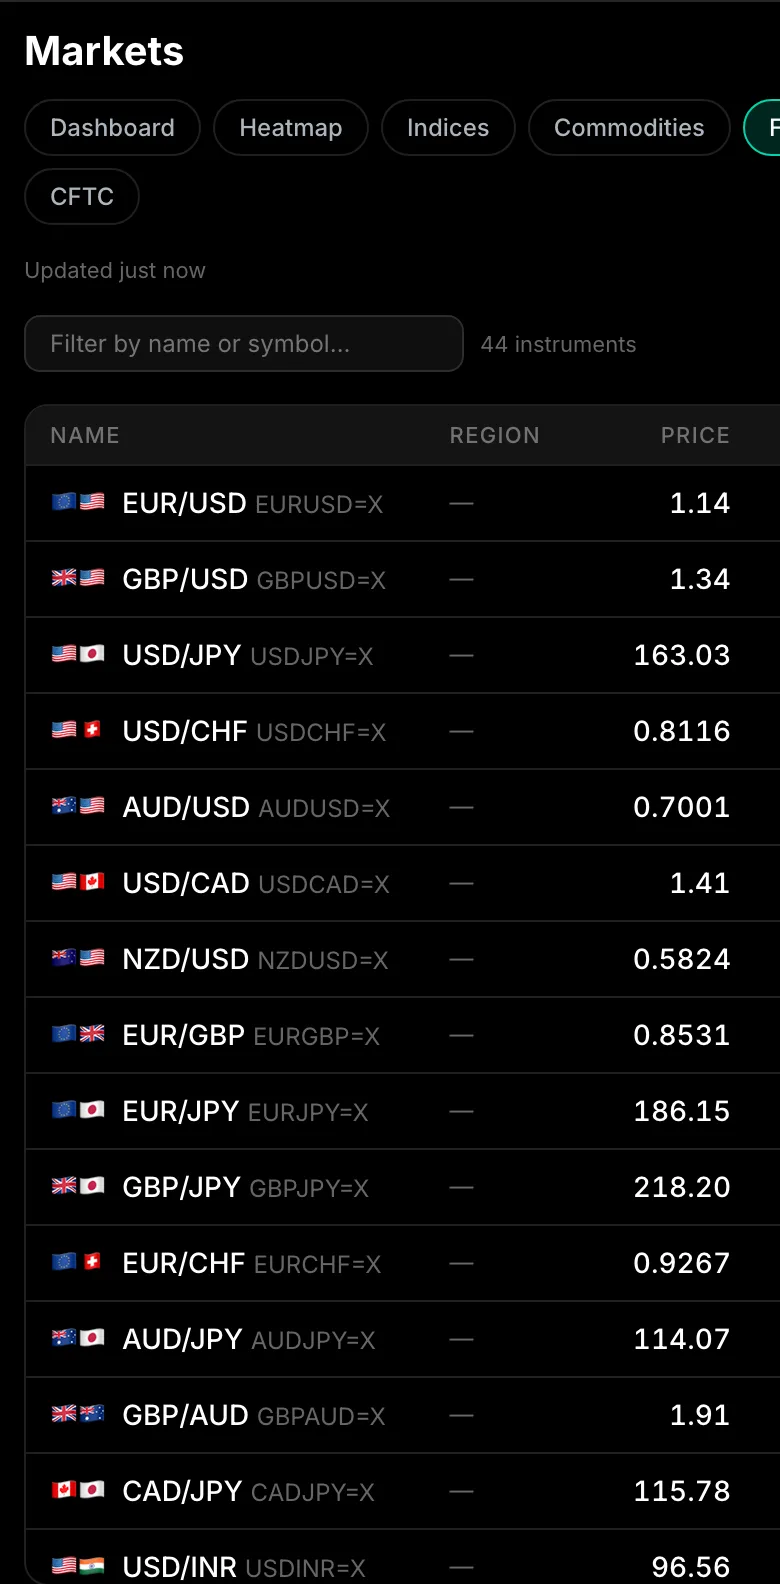
46 global indices, 23 commodities, and 44 forex pairs — streaming live with candlestick charts on tap. Plus CFTC hedge-fund positioning on metals and central-bank policy rates, so you see what the big money holds and what the policy gravity looks like.
Market-Cap Treemap
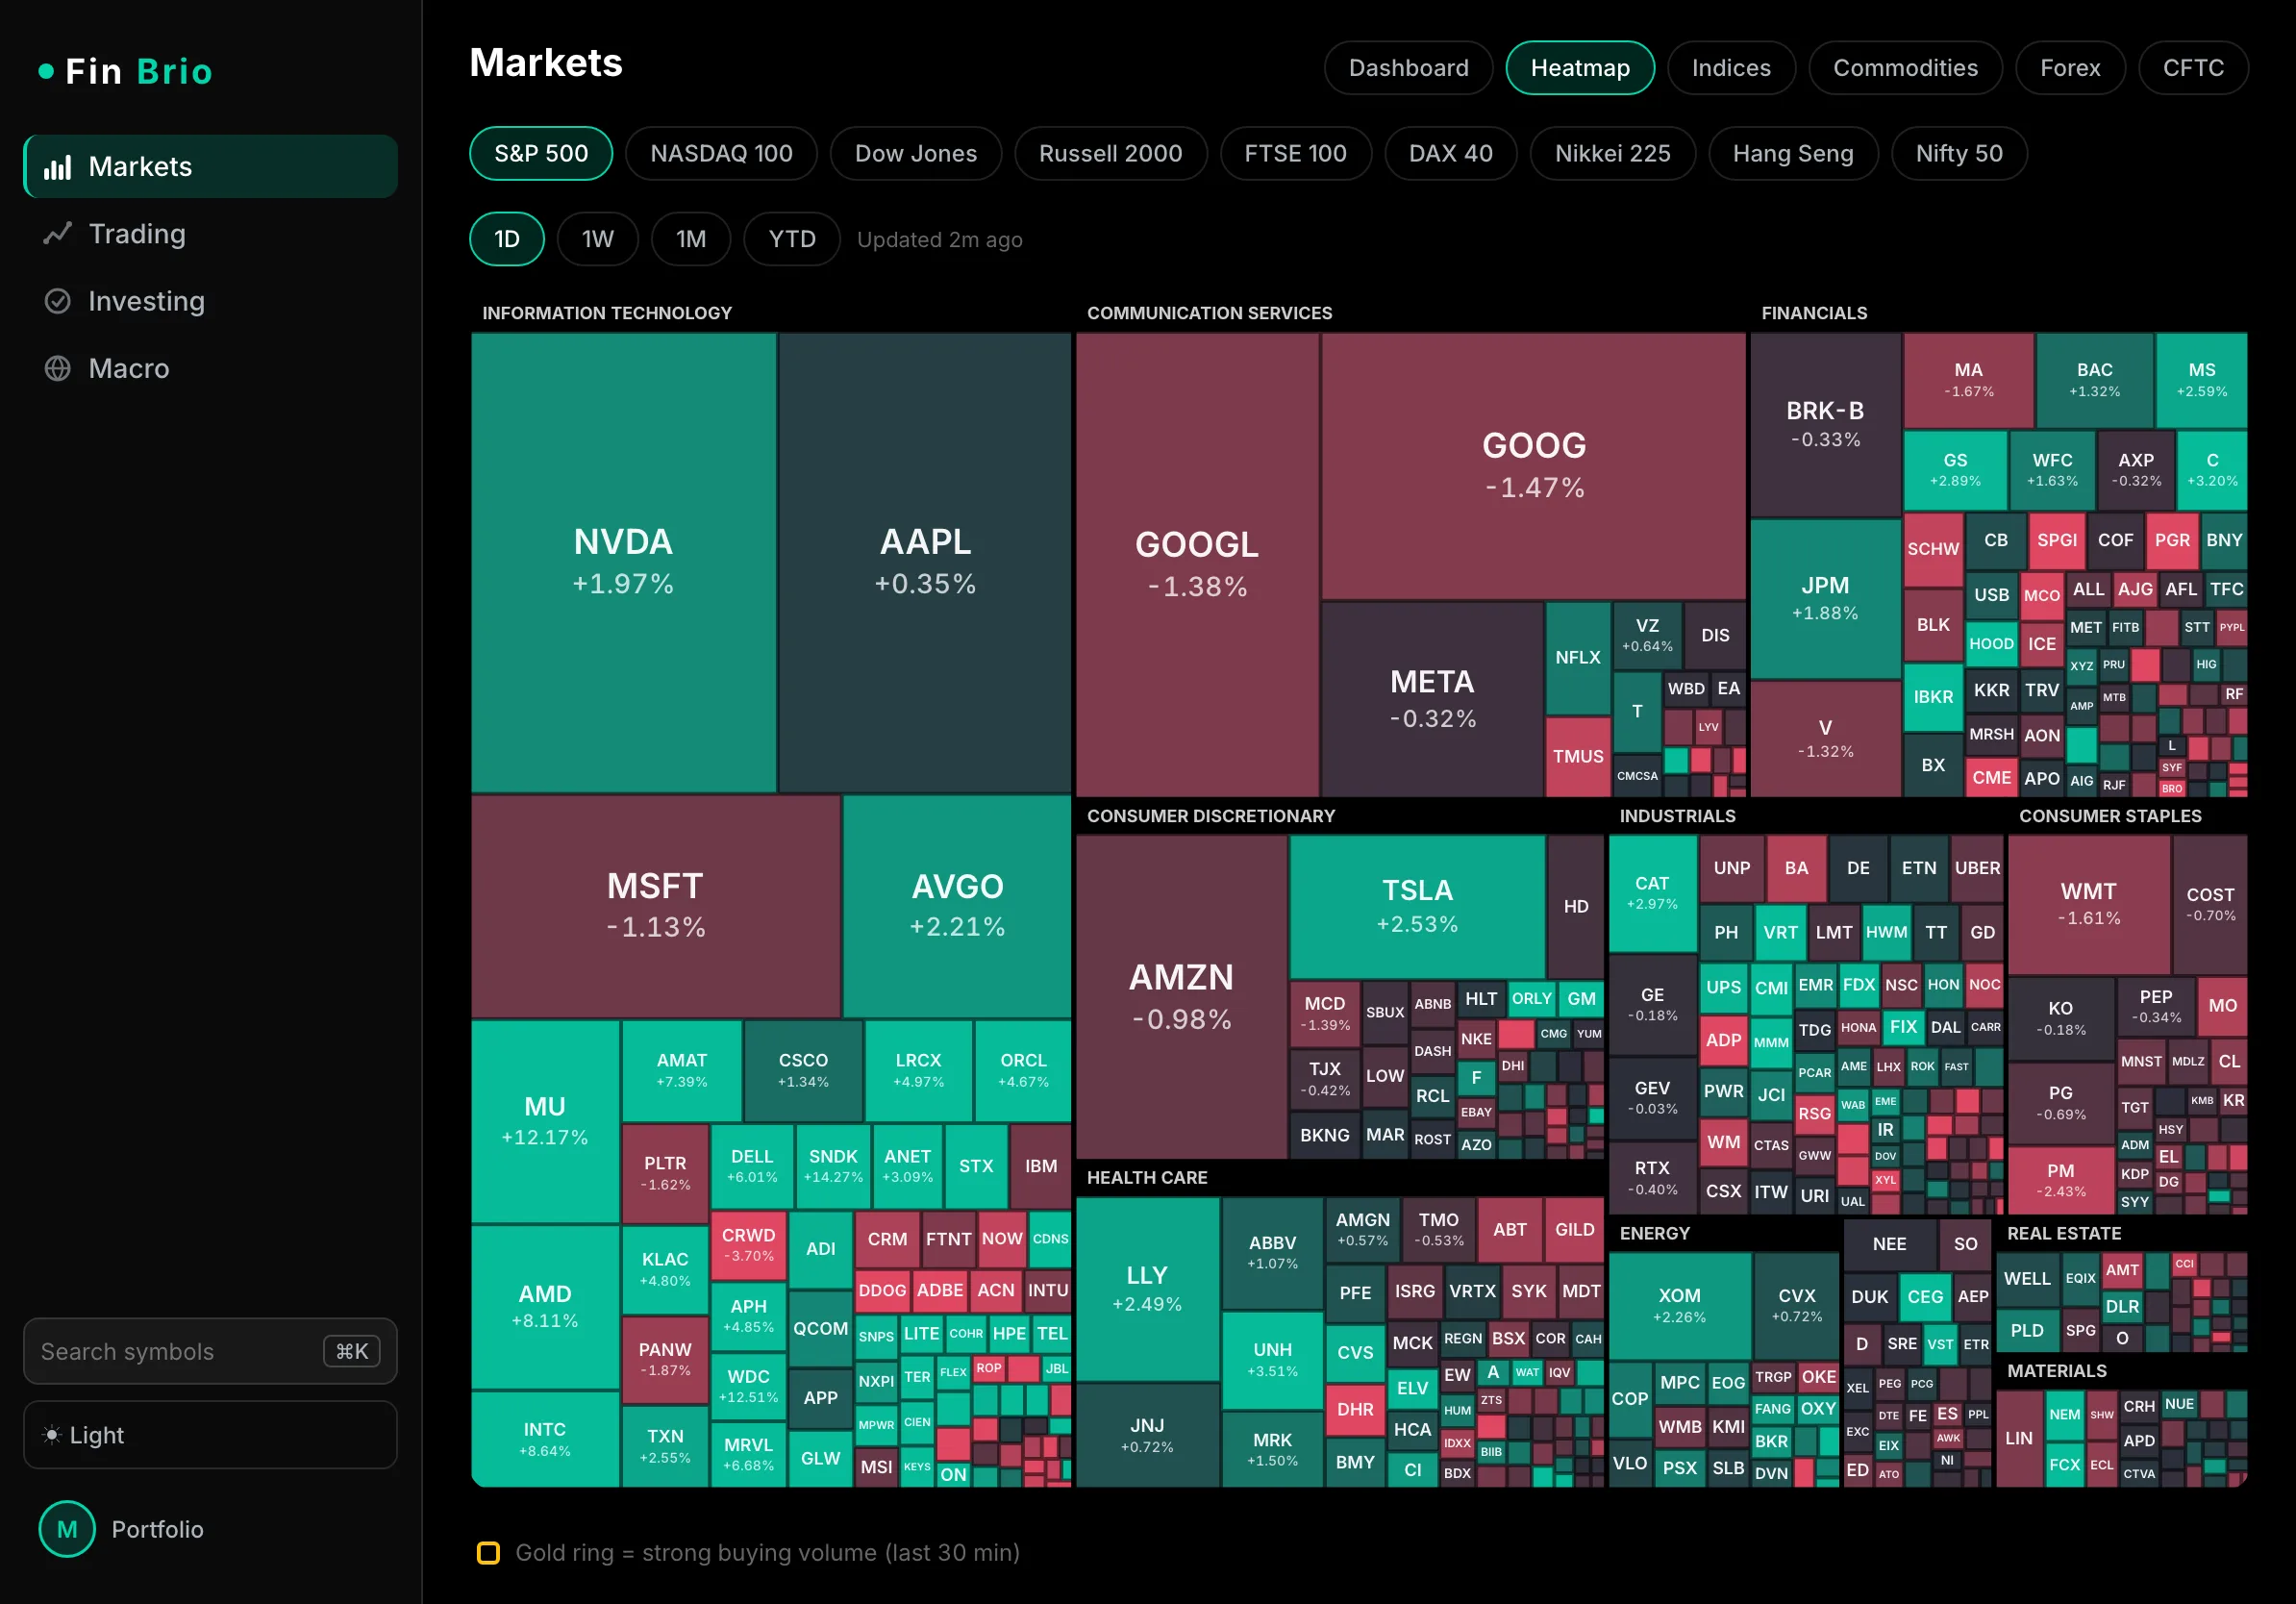
A market-cap-weighted heatmap of nine major indices — S&P 500, NASDAQ 100, Dow, Russell 2000, FTSE 100, DAX 40, Nikkei 225, Hang Seng and Nifty 50 — FX-normalized to US dollars so tiles are comparable across markets. Timeframes from one day to year-to-date, with top gainers and losers per session.
Smart Money & Exposure
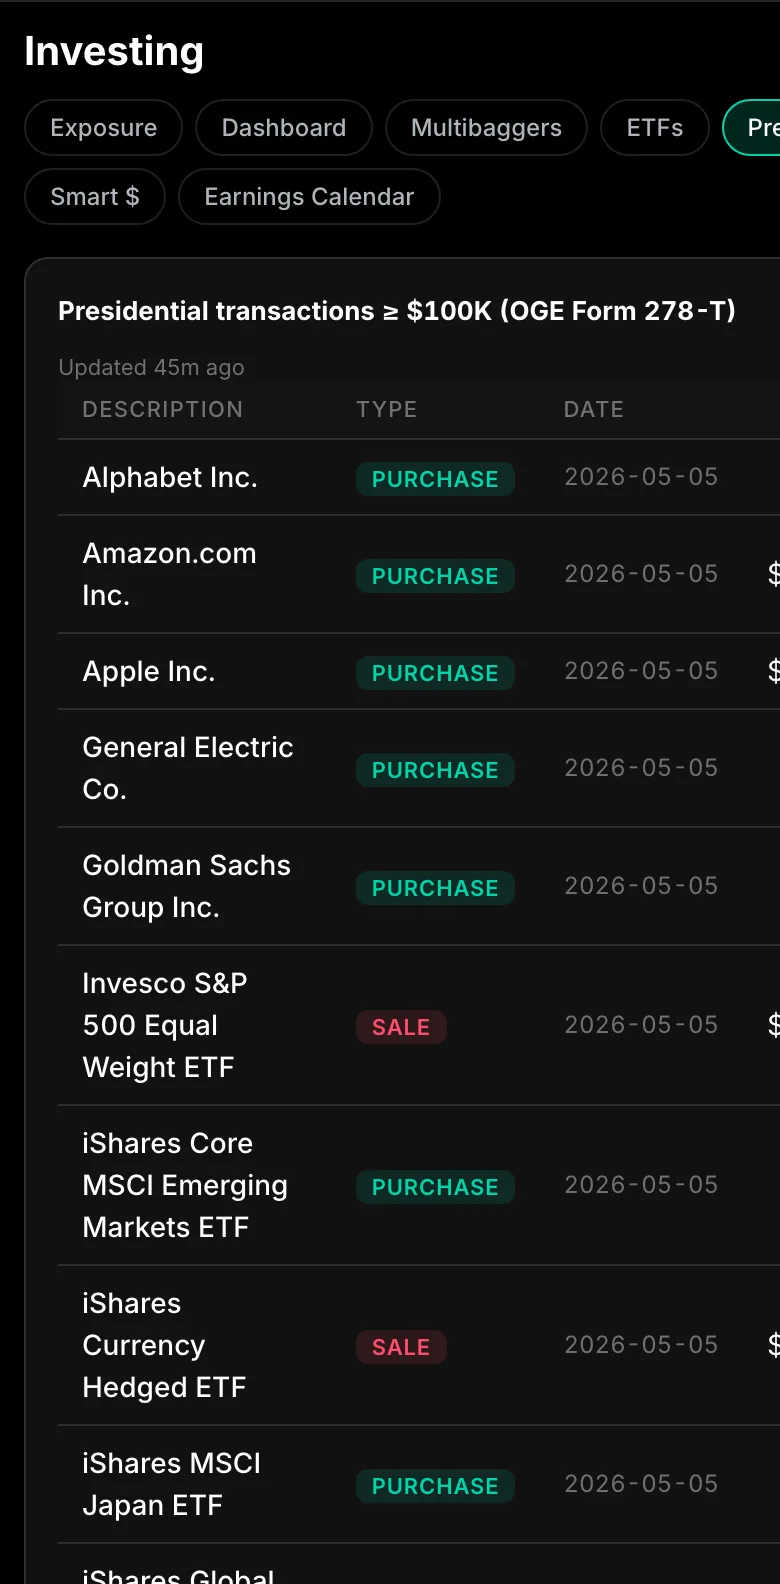
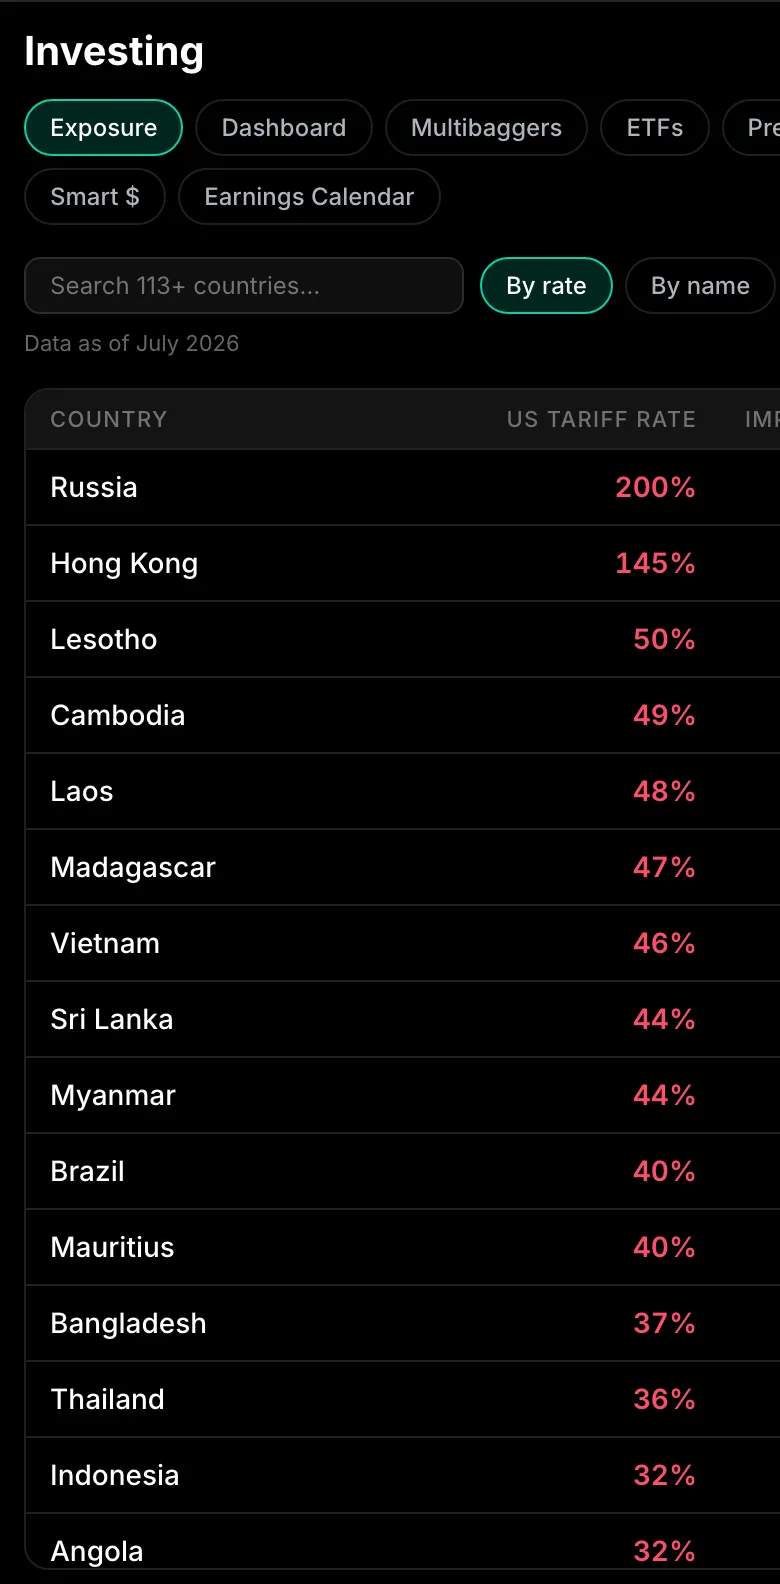
Public disclosures, surfaced the moment they land: presidential OGE transactions, SEC insider cluster buys, and quarter-over-quarter lobbying spend. Plus a tariff-exposure browser ranking 113+ countries by US tariff rate with per-sector breakdowns.
Macro Intelligence
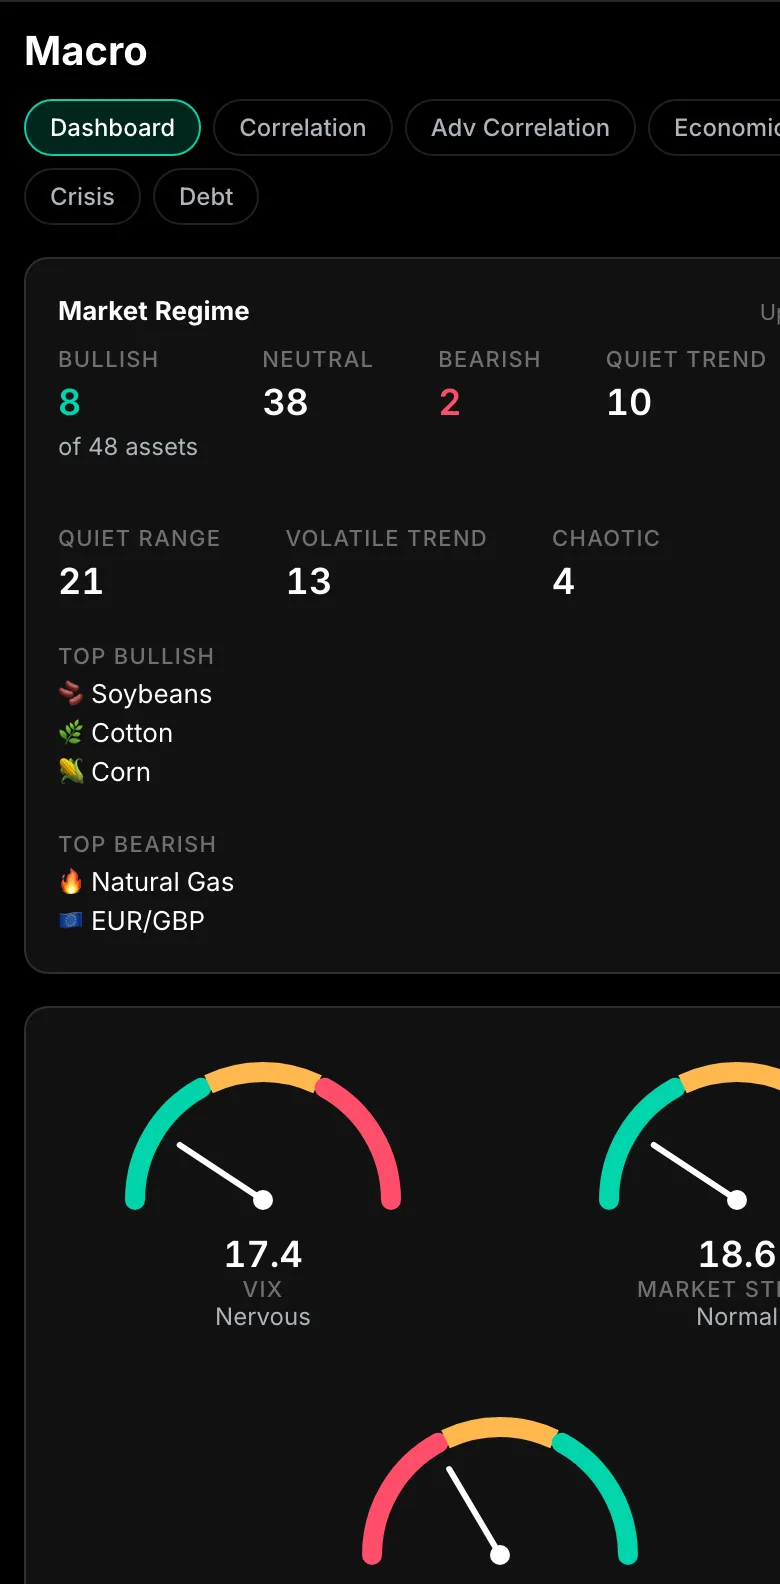
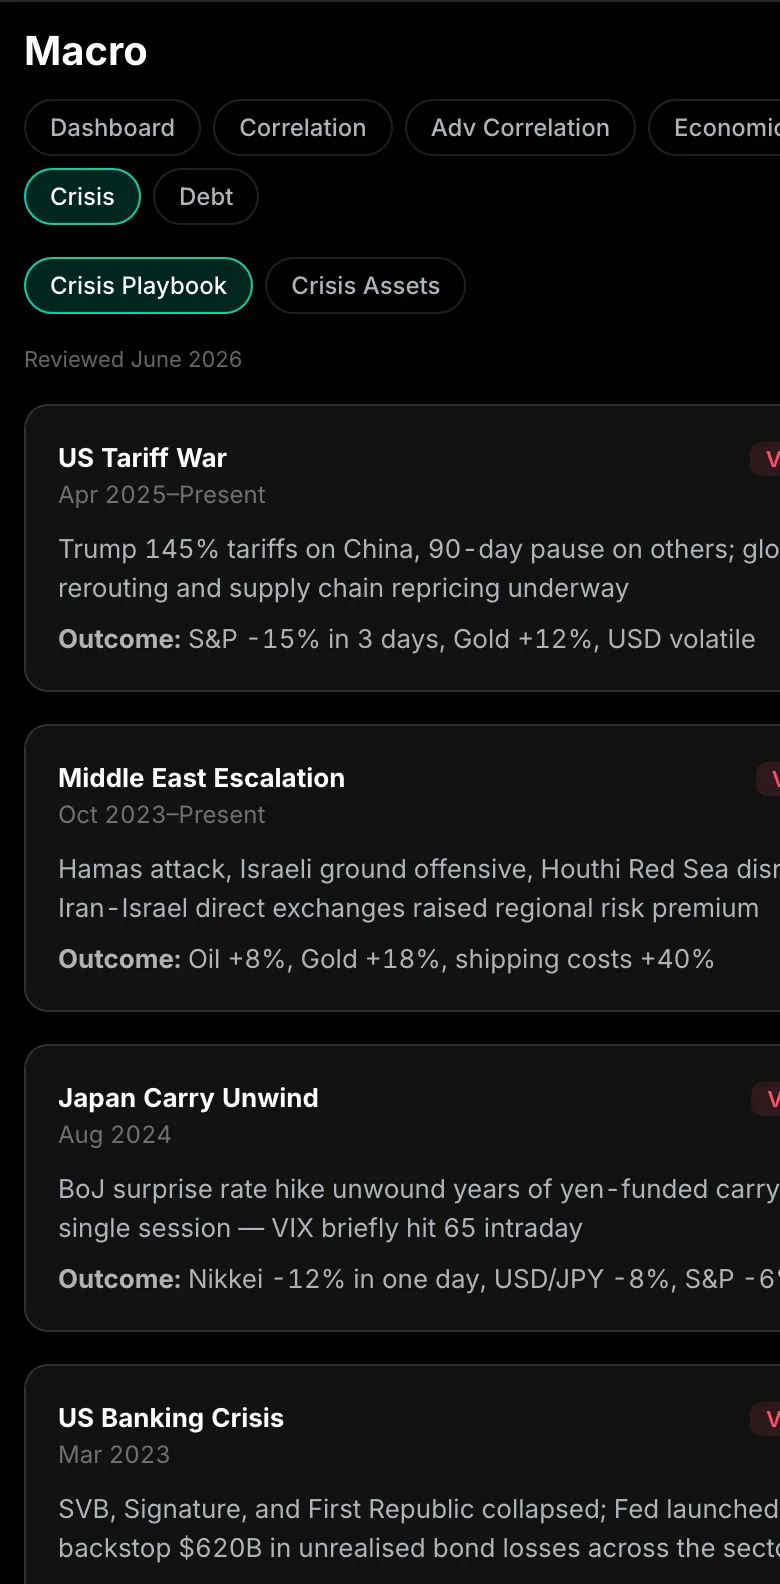
A market-stress meter, VIX and Fear & Greed gauges, the yield curve, sector rotation, and cross-asset correlations — distilled into one dashboard that tells you whether it's a bullish tape, a chop-fest, or something worse.
And then some
Set a level, get a push the moment it breaks — checked every 20 seconds. Regime-change alerts fire automatically when the options market flips from contango to backwardation.
Walk-forward backtests per strategy — win rate, total return, max drawdown, Sharpe, and the full trade log. Verify before you trust.
Headlines per asset with sentiment scoring, plus an AI read on what the news implies for short-term price action.
On-demand analyst commentary for any symbol — what's driving it, what to watch, in plain English.
Upcoming earnings across the market, so a surprise print never blindsides an open position.
High-impact events — FOMC, CPI, NFP — pulled live so you know what's on deck before the market does.
Cross-asset correlations at a glance — know what actually diversifies you and what secretly moves together. The hidden risk most portfolios miss.
Disaggregated COT data on metals: see whether hedge funds are net long or short before you pick a side.
Policy rates across major central banks in one table — the gravity every other market obeys.
The national debt ticking live from the US Treasury's own data, with context on what it means.
GDP, trade balance and military spend per country from the World Bank — plus that country's listed stocks, including NSE/BSE for India.
Advanced TradingView charts inline, or one tap to open any symbol in the full TradingView app.
Star anything — commodities, indices, forex, crypto, stocks — and get your own market view first.
Dark and light themes, adjustable type size, and your choice of chart engine. Small things, done right.
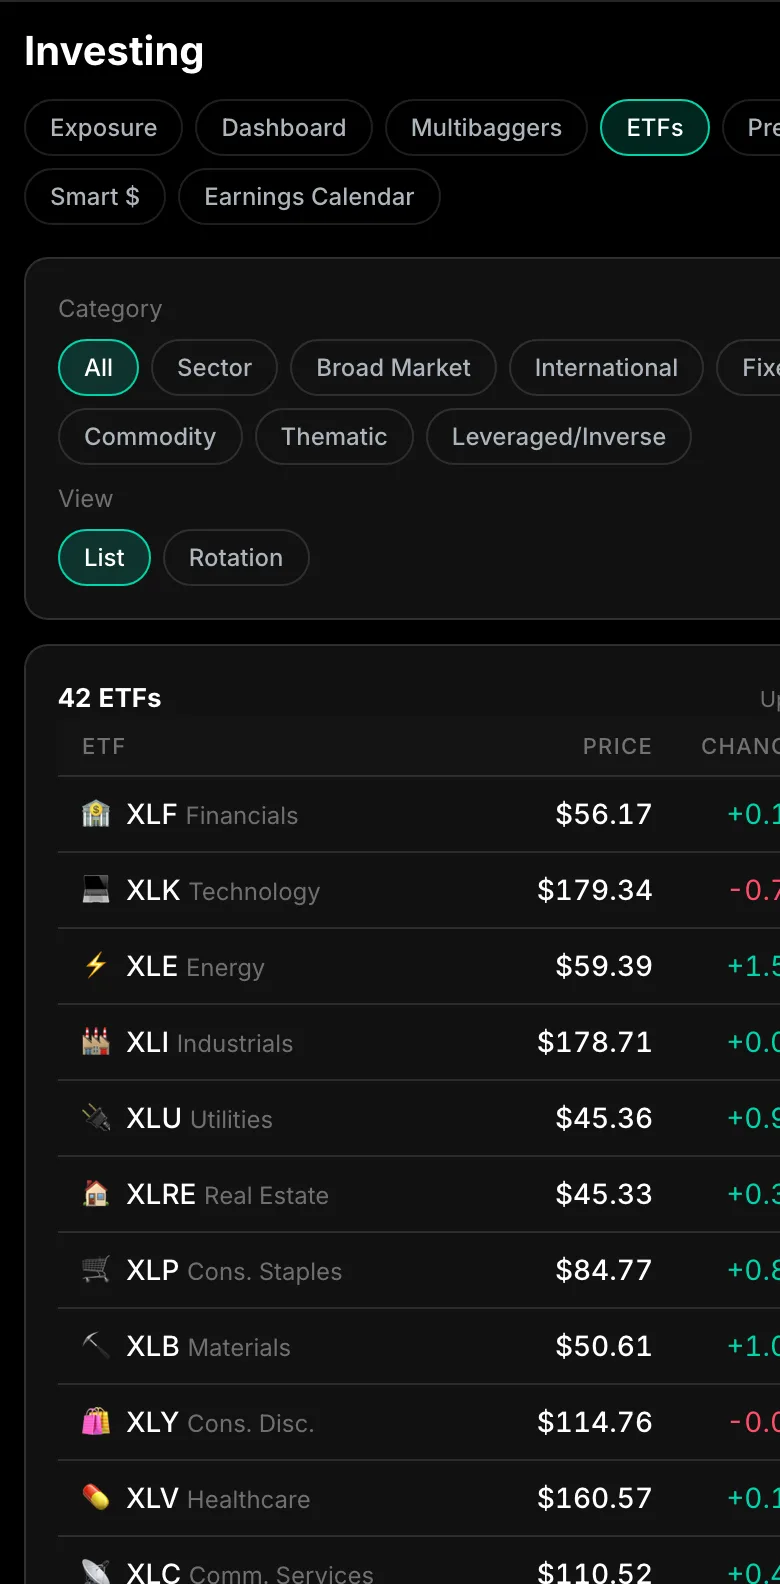
Relative Rotation Graph quadrants — Leading, Improving, Weakening, Lagging — for sectors and 42 curated ETFs.
Pre-market and after-hours prices where they exist — never stare at a stale close without knowing it.
Inside the app
Scroll sideways — every screen is the real app with live data.
No black box
Every number in FinBrio traces back to a primary source — not a scraped rumor.
The alternative is seven tabs
| Capability | A pile of free sites | A pro terminal | FinBrio |
|---|---|---|---|
| Live indices, commodities & forex | Scattered across tabs | ✓ | ✓ |
| AI signals with entry, stop & target | ✗ | ✗ | ✓ |
| Presidential, insider & lobbying disclosures | If you know where to dig | — | ✓ |
| Tariff exposure, 113+ countries | ✗ | ✗ | ✓ |
| Macro regime, VIX & crisis playbook | Partial | ✓ | ✓ |
| Lives on your phone | ✓ | Barely | ✓ |
| Price | Free, but chaotic | $20K+/yr | Free to start |
Pricing
Everything you need to watch the market
For traders who act on the data
Subscriptions are handled in-app. Prices shown in the app store for your region.
Why we built it
The edge was never the data. It was having all of it in one place, fast enough to act on.
An insider files a buy. A tariff shifts. The VIX curve inverts. The macro regime turns. Each of those lives on a different site, behind a different login, on a different delay — and by the time you've stitched them together, the move is already priced in. FinBrio started as one question: what if the whole picture fit on a single screen, in your pocket, updating live? Everything above is our answer.
FAQ
FinBrio is a global financial intelligence app for iOS and Android. It brings live markets, AI-generated trade signals, smart-money tracking (presidential, insider and lobbying disclosures), US tariff exposure, ETF analytics, and macro stress monitoring into one dashboard — the data professionals watch, without the terminal price tag.
For 49+ assets across commodities, indices, forex, and crypto, FinBrio computes a BUY, HOLD, or SELL stance with a concrete entry, stop-loss, take-profit, risk/reward ratio, and confidence score — plus the reasoning behind it. Nine strategy engines (S1–S9) cover different trading styles, including S9, a silver-specific liquidity-sweep strategy. Every strategy ships with a walk-forward backtest showing win rate, drawdown and Sharpe so you can verify before you trust.
A breakout scanner that screens indices, forex, commodities and crypto through three generations of Pine-script-aligned engines. The v3 'Super Pine' engine looks for five structural signals — thrust, base, uptrend, new-high reclaim, and regime breakout — and every engine has a historical backtest viewer so you can see how its signals actually performed.
FinBrio aggregates public disclosure filings — presidential OGE Form 278-T transactions of $100K or more, SEC EDGAR insider cluster buys, and US Senate lobbying-disclosure spend — and surfaces them ranked and searchable, so you can see what the smart money is actually doing.
A browsable ranking of 113+ countries by their US tariff rate, with per-sector breakdowns, debt-to-USA context, and plain-English explanations of what each rate means. Made for anyone following how tariffs hit real companies and countries — exposure at a glance, without a spreadsheet.
Country-specific high-momentum stock scans across seven markets — US, India, UK, Japan, Hong Kong, China and Euronext — with a minimum-signals filter and country-aware search, so you can scan any individual stock on demand.
A market stress meter, VIX gauge with term-structure regime detection, the Fear & Greed index, a live yield curve with inversion history, sector rotation quadrants (RRG), a cross-asset correlation matrix, a historical crisis playbook, a live US debt clock, a high-impact economic calendar, and AI-written macro briefings.
The core app is free: live markets across 46 indices, 23 commodities and 44 forex pairs, the market-cap heatmap, S1–S3 AI signals, the Power Moves scanner, smart-money tracking, tariff exposure, multibaggers, the ETF explorer, and the full macro dashboard. A single Pro subscription unlocks advanced strategies, unlimited alerts, AI analyst notes and macro briefings, AI-powered tariff analysis, extended timeframes, and advanced backtest filtering.
Market data comes from Yahoo Finance; hedge-fund positioning from the CFTC's Disaggregated COT report; the debt clock from the US Treasury's FiscalData API; tariff data from USTR Section 301 schedules; presidential (OGE Form 278-T), insider (SEC EDGAR) and lobbying (US Senate LDA) disclosures from official public sources; and country statistics from the World Bank.
No. FinBrio is an information and analytics tool. Signals, backtests, and briefings are for informational purposes only and are not investment advice. Markets involve risk — always do your own research.
FinBrio is live now — on the App Store, and as a full web app at app.finbrio.net that works in any browser, no install required. Sign in once and your account, watchlist, and Pro plan follow you across both. Android is coming soon.
FinBrio is live on iOS and the web. Get the app, or jump straight in at app.finbrio.net — no install required.